Powered by Android Stuiod Profiler
Profiler usage:
Reference: https://blog.csdn.net/Calvin_zhou/article/details/119681272
Select View > Tool Windows > Profiler or click the Profile icon in the toolbar
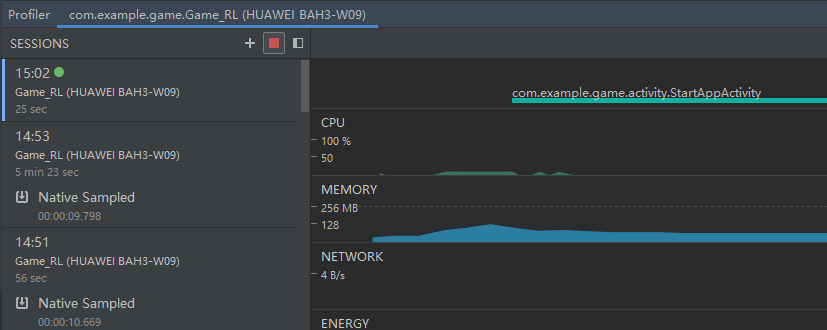
TAP ANYWHERE ON THE MEMORY TIMELINE TO OPEN THE MEMORY PROFILER
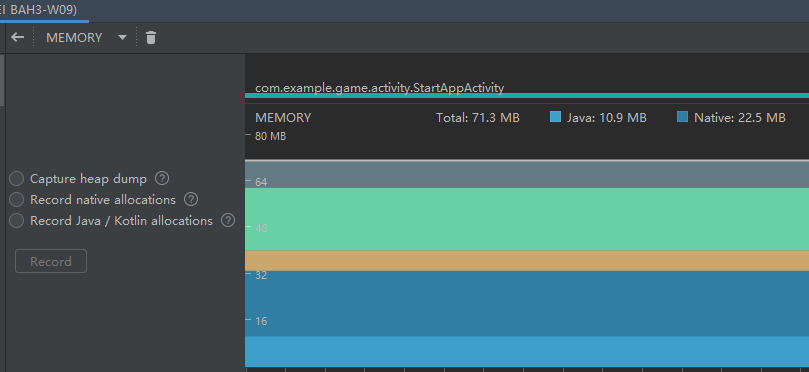 Memory Classification:
 Java: The memory of an object allocated from Java or Kotlin code
Native: The memory of an object allocated from C or C++ code
Graphics: The graphics buffer queue is the memory used to display pixels to the screen, including GL surfaces, GL textures, and so on
Stack: The memory used by the native and Java stacks in your app. This is usually related to how many threads your app runs
Code: Your app is used to process code and resources (such as dex bytecode, optimized or compiled dex code, . so libraries and fonts).
Others: The system used by your app is not sure how to classify memory
Allocated: The number of Java/Kotlin objects assigned by your app. This number does not count towards objects assigned in C or C++
Get the actual memory usage of the application
https://zhuanlan.zhihu.com/p/372883142
Generally, PSS is used as a memory performance indicator, use method 3
VSS - Virtual Set Size (including memory occupied by shared libraries)
RSS - Resident Set Size Actual use of physical memory (including memory occupied by shared libraries)
PSS - Proportional Set Size Actual physical memory used (proportional allocation of memory occupied by shared libraries) If 3 processes use the same shared library, then the PSS of each process includes 1/3 of the size of the shared library memory. Usually we use PSS size as a memory performance metric.USS - Physical memory occupied by the Unique Set Size process alone (excluding memory occupied by shared libraries)
In general, the memory usage is as follows: VSS >= RSS >= PSS >= USS
Method 1 adb
- adb shell

- top

- Check the PID based on the package name
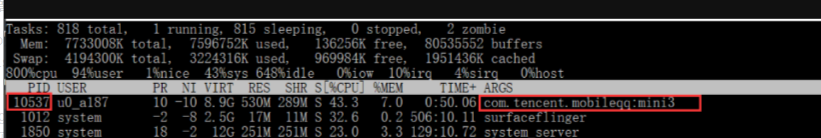 1. adb shell dumpsys meminfo package name or process ID
 adb shell dumpsys meminfo com.tencent.mobileqq:mini3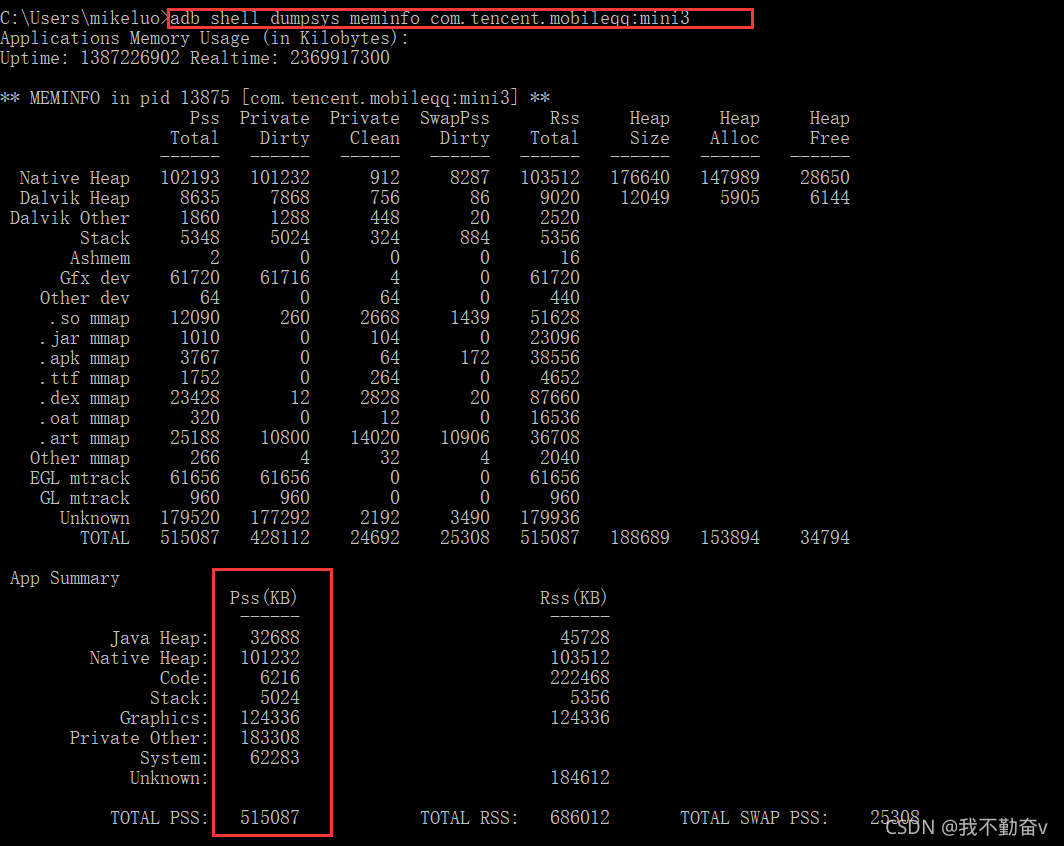 1. If you want to see the memory cost of all processes of an app
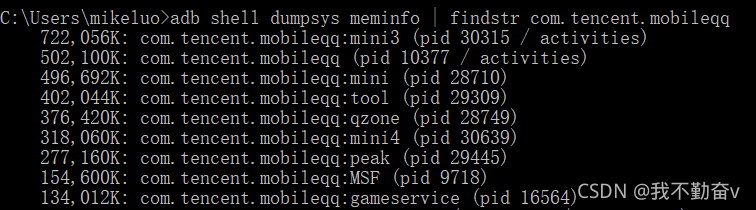
 Use the command adb shell dumpsys meminfo | findstr package name (win10 cmd), as shown in the figure, you can know which processes QQ has and the memory occupation of the corresponding process.
 ## Method 2 pid status
 "/proc/" + android.os.Process.myPid() + "/status" path file.
public static long getProcessRealMemory() {
        String memFilePath = "/proc/" + android.os.Process.myPid() + "/status";
        BufferedReader bufferedReader = null;
        try {
            FileInputStream fileInputStream = new FileInputStream(memFilePath);
            InputStreamReader inputStreamReader = new InputStreamReader(fileInputStream, "UTF-8");
            bufferedReader = new BufferedReader(inputStreamReader);
            String line;
            while ((line = bufferedReader.readLine()) != null) {
                Log.d(TAG, " read line : " + line);
                if(! TextUtils.isEmpty(line) && line.contains("VmRSS")) {String rss = line.split(":")[1].trim().split( " ")[0];
                    return Integer.parseInt(rss) * 1024;
                }
            }
        } catch (Exception e) {
            e.printStackTrace();
        } finally {
            if(bufferedReader != null) {
                try{
                    bufferedReader.close();
                } catch (Exception e) {
                    e.printStackTrace();
                }
            }
        }
        return -1;
}Advantages: There is no permission restriction for the time being, and it can be obtained in real time
Disadvantages: The memory obtained by this method of reading files is RSS. What we usually expect is to get a PSS
Difference between RSS and PSS:
RSS - Resident Set Size Actual use of physical memory (including memory occupied by shared libraries)
PSS - Proportional Set Size Actual physical memory used (proportional allocation of memory occupied by shared libraries) If 3 processes use the same shared library, then the PSS of each process includes 1/3 of the size of the shared library memory. Usually we use PSS size as a memory performance metric.
Method 3 ActivityManager (PSS)
ActivityManager activityManager = (ActivityManager) getSystemService(Context.ACTIVITY_SERVICE);
                final Debug.MemoryInfo[] memInfo = activityManager.getProcessMemoryInfo(new int[]{android.os.Process.myPid()});
final int totalPss = memInfo[0].getTotalPss();Pros: PSS is obtained
Disadvantages:Android P limits the frequency above,It takes about 5 minutes (different mobile phones have different intervals) to get the new value。 And the PSS you get doesn't include Graphics.
Method 4 Debug.getMemoryInfo
Debug.MemoryInfo memoryInfo = new Debug.MemoryInfo();
    Debug.getMemoryInfo(memoryInfo);

if (Build.VERSION.SDK_INT >= Build.VERSION_CODES. M) {
        String javaHeap = memoryInfo.getMemoryStat("summary.java-heap");
        String nativeHeap = memoryInfo.getMemoryStat("summary.native-heap");String code = memoryInfo.getMemoryStat("summary.code");
        String stack = memoryInfo.getMemoryStat("summary.stack");
        String graphics = memoryInfo.getMemoryStat("summary.graphics");
        String privateOther = memoryInfo.getMemoryStat("summary.private-other");
        String system = memoryInfo.getMemoryStat("summary.system");
        String swap = memoryInfo.getMemoryStat("summary.total-swap");
}Advantages: PSS is obtained, and there is no frequency limit, and the components of PSS can be obtained
Cons: The acquired PSS does not include Graphics. Android below 6 does not allow you to get the occupied memory of a component through the Debug.MemoryInfo.getmemoryStat interface, but only through the reflection method
Get the memory information of the phone
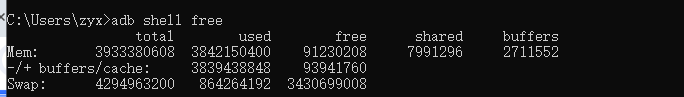
- View the memory usage information
Adb shell free
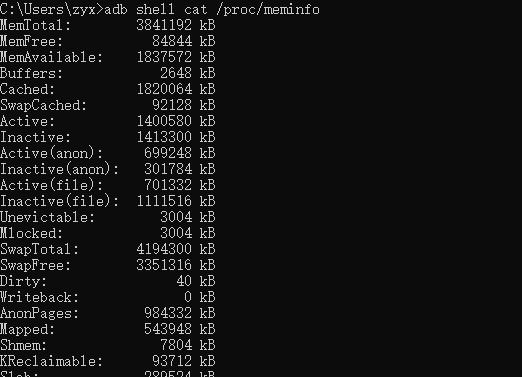
- View the memory usage details
Adb shell cat /proc/meminfo